Reactive notebooks & AI in chart blocks
Reactive notebook execution
Traditional data notebooks are executed block-by-block, allowing for a block to be executed out-of-order or even repeatedly. While this is very powerful, it also has the potential to create hidden state that can complicate data reproducibility and clarity.
One common problem is the potential 'staleness' in your notebook. For instance, if you update data at the beginning of your notebook but don’t rerun the whole thing, later sections might still be using old, outdated data and outputs (e.g. a chart that doesn’t reflect your latest filtering logic). Typically you would circumvent these problems by manually re-running your whole notebook (or larger sections of it), which can be an inefficient (and still error-prone) solution.
To resolve these core issues, we've introduced reactive execution mode in our notebooks. Simply put, reactive mode makes notebooks similar to Excel spreadsheets — you just input the data and code, and the whole document updates itself accordingly. No need to click to manually run blocks. This makes reactive notebooks easier to work with and reason about.
To activate this mode, simply click on the option dropdown next to the Run notebook button and select Block and dependent blocks.
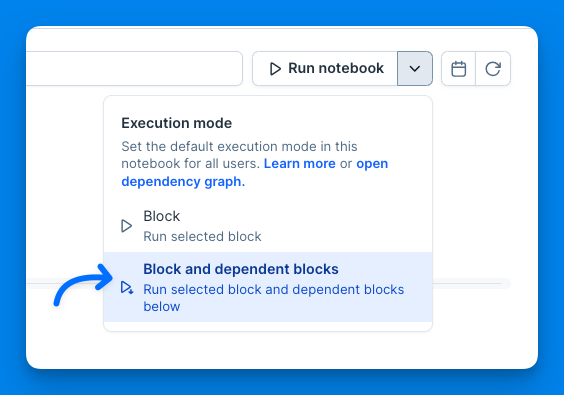
Once enabled, reactive execution becomes the default mode. This means that when you execute a specific block, all downstream blocks with dependent variables will automatically be re-executed. For instance, if you update an input block, any other blocks that depend on this input will automatically update. Similarly, if you alter the filtering logic on a dataframe, any charts visualizing this dataframe will automatically refresh to reflect the changes.
Reactive execution mode is a major enhancement to the core notebook experience, boosting your efficiency and helping to ensure that your data and results always remain up-to-date.
Check out this video to see it an action! You can also discover more details in our 👉 docs.
AI in chart blocks
With our latest update to Deepnote AI, you can now generate or edit visualizations in your chart blocks by using natural language. Just type in your question or the specifics of the visualization you need, and hit Submit. In seconds, you'll see a suggested chart. You can approve this suggestion by clicking Done or reject it with Undo.
The suggested chart comes fully configured, serving as an ideal starting point. From there, you can fine-tune the details to better suit your needs. If you need further modifications, just submit a new prompt, and Deepnote AI will adjust your existing chart accordingly.
Please note that Chart AI is currently in Beta. While we are excited to offer this feature, some functionality may not be perfect yet. We welcome your feedback to improve the service—use the built-in 👎 button or share your thoughts on our product portal.
For more details on chart blocks, visit our 👉 docs.